
Beat–Meet–Lose Dashboard Design
PROJECT SUMMARY
A rate competitiveness analysis system that standardized issue codes and workflows to diagnose pricing gaps faster and created a scalable framework later adopted globally
Expedia’s competitiveness tracking system showed when the platform “lost” against competitor sites (Agoda, Booking.com, local OTAs) by comparing lowest rates and availability but failed to explain why. This lack of visibility slowed corrective action, diverted bookings to competitors, and made regional performance measurement inaccurate.
To address this, the Korea Market Associates (MA) team launched the Beat–Meet–Lose (BML) Dashboard Project — Expedia Korea’s first official research initiative focused on diagnosing competitiveness failures. We created a standardized issue coding system, built a resolution playbook, and validated findings with other APAC markets to prove the issue was regional. The new structure doubled the number of cases resolved, boosted regional bookings, eased onboarding for a rapidly growing APAC workforce (10–20% increase in 6 months), and became the foundation for Expedia’s upgraded global competitiveness dashboard.
TIMELINE
Jul 2018 – Jan 2019
TOOLS
MS Office, Google Workspace, SQL, Tableau
TEAM
Korea Team (myself + 4 colleagues), collaboration with APAC counterparts, and Expedia Global
MY ROLE
Project Lead – responsible for research, analysis, process design, training, and presenting findings to APAC and Global executives
WHAT THIS PROJECT DEMONSTRATES
-
Analytical rigor: Turned fragmented, anecdotal reports into structured, quantifiable insights.
-
Cross-disciplinary expertise: Combined market research, data analysis, workflow design, and stakeholder management.
-
Project management & organization: Delivered a complex 8-month initiative while maintaining operational KPIs.
-
Influence without authority: Persuaded APAC and Global HQ to adopt a locally initiated framework by proving regional impact.
-
Collaboration: Korea team, APAC peers, and global product owners into a unified process.
PROBLEM CONTEXT
There were multiple issues caused by the lack of a standardized system for diagnosing and resolving rate competitiveness problems. The previous workflow involved 3 steps, which caused high inefficiency.
Previous Workflow

1
Review the internal dashboard to see the price and inventory offerings across different platforns
2


Go to the site to verify the data from the dashboard. Find carefully what is causing this difference.
3

Escalate the findings to the relevant account managers to talk to the hotels to fix the issue.
Issues with this workflow:
-
Team Dynamic
-
Each Market Associate–Account Manager pair was assigned to a geographic segment in Korea.
-
Market Associates (MAs) monitored daily pricing competitiveness, investigated root causes (e.g., mismatched rates, inventory outages, untracked local OTA promotions), and resolved simple issues such as inventory miss-outs by directly contacting hotel partners.
-
Account Managers (AMs) handled complex cases that required negotiation or partner strategy changes, relying on MA research to take action in hotel meetings
-
-
Data Collection & Communication Gaps
-
Operational inefficiency
-
MAs spent excessive time manually investigating each “lost” signal.
-
No automated way existed to detect patterns or guide next steps, slowing resolution.
-
On average, five issues were escalated per day, but only three were resolved, leaving recurring gaps and slow turnaround.
-
-
Incomplete competitiveness visibility
-
The global dashboard missed local OTAs that heavily influenced APAC bookings.
-
Even after rate adjustments, bookings sometimes failed to recover because untracked local competitors continued to undercut Expedia.
-
-
No shared data or leverage
-
Findings were stored privately on local drives and shared only by email or verbally.
-
No national-level reporting existed to spot recurring issues, measure resolution times, or share successful solutions across the team.
-
Leadership had limited visibility into how widespread or impactful competitiveness failures really were.
-
-
DESIGN PROCESS
The goal of this project was to improve the efficiency of identifying and resolving issues to ensure our site offers the most competitive offerings compared to competitors.
1

All team members began sharing issues and findings in a shared Google Doc to identify which problems were recurring and to detect emerging patterns. Over this period, 480 cases were compiled, creating a comprehensive dataset for analysis.
2
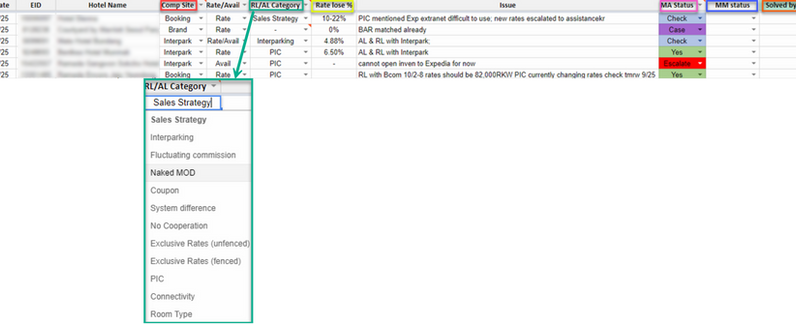
The team analyzed the collected data, identified the 13 most common issues, and assigned clear keyword labels to define them as categories. This process continued for two additional weeks, adding 210 more cases.
3

Ultimately, the team refined the structure into 12 main categories and 14 subcategories based on approximately 690 total cases. Using these clearly defined categories and subcategories, they built a coded playbook containing best practices and recommended solutions for each type of issue, making future problem-solving faster and more consistent.
TIMELINE
The timeline started with project kickoff, team training, and data collection, then moved into analysis, categorization, and playbook creation. It progressed through validation with regional teams, pilot-based adjustments, and concluded with final approval and global integration.
Announced the current status, highlighted inefficiencies, and communicated project goals to the Korea team. Requested cooperation for data compilation and project initiation. Trained the team on using a shared sheet, transitioning from email-based communication to a collaborative Google Sheet.
Team members logged issues and findings in the shared sheet to identify recurring problems and detect patterns. Compiled 480 cases, creating a comprehensive dataset for analysis.
Analyzed the data, identified the 13 most common issues, and assigned clear keyword labels to define them as categories. Continued this process for two more weeks, adding 210 additional cases.
Refined the structure into 12 main categories and 14 subcategories based on approximately 690 total cases. Built a coded playbook with best practices and recommended solutions to standardize and speed up problem-solving.
Compared the number of cases tackled each week to pre-project performance and confirmed improved resolution rates, signaling the project’s success. Presented interim findings to APAC and Global VPs for feedback and alignment.
Partnered with teams in Japan, Taiwan, Singapore, and Australia to refine and validate the categories.
Adjusted codes and workflows based on feedback from the APAC pilot.
Presented the final framework at the APAC all-hands meeting and escalated it to Global HQ for review. Handed off the finalized framework for global integration into the official BML Dashboard.
Weeks
23-24
Weeks
19-22
Weeks
13-18
Week
12
Weeks
10-11
Weeks
8-9
Weeks
3-7
Weeks
1-2
FEEDBACK
-
APAC leadership confirmed this was a regional, not local, problem.
-
Global HQ initially dismissed as “nice to have,” but reversed position after APAC-wide data was presented.
-
Korea team was awarded Best Teamwork of the Quarter.
KEY FUNCTIONS & DELIVERABLES
-
Standardized Issue Categories – standardized reasons for competitiveness failures.
-
Playbook – best practices for handling each issue, reducing investigation time.
-
BML Dashboard – officially developed globally (September 2019), informed directly by this project.
KEY OUTCOMES
-
Increased number of cases tackled from 25 → 33 per week (32% increase). The success rate increased from 56% to 76%.
-
Regional bookings increased by 20% after monitoring local OTAs via the enhanced BML Dashboard.
-
Elevated visibility of APAC challenges within global leadership.
-
Framework scaled into Expedia’s official BML Dashboard with the categories, improving global processes.
REFLECTION
Key Learnings:
-
Data drives influence: Converting anecdotal complaints into hard metrics turned a local efficiency idea into a global product priority.
-
Regional validation matters: Early collaboration with Japan, Taiwan, Singapore, and Australia reframed the problem as APAC-wide, unlocking global attention and adoption.
-
Structured time management enables dual roles: Allocating fixed weekly time and replacing ad-hoc reporting with codes made it possible to run a strategic project without sacrificing daily KPIs.
What I would improve if I had more time:
-
Prototype earlier: Building a visual or clickable dashboard mid-project could have accelerated HQ buy-in and reduced initial skepticism.
-
Expand validation sooner: Engaging more APAC markets (e.g., India, Southeast Asia) early would have made the business case stronger and reduced the perception of the project as Korea-centric.
Overall, the BML Dashboard project demonstrated how structured research, regional collaboration, and persistence under constraints could transform a local efficiency idea into a global solution with measurable revenue impact.